
Standard Error Calculator: Calculate SE Easily + Formula & Examples
Calculate standard error quickly with formulas and examples. Learn SE for means, proportions, two samples, confidence intervals, Excel, and Casio.
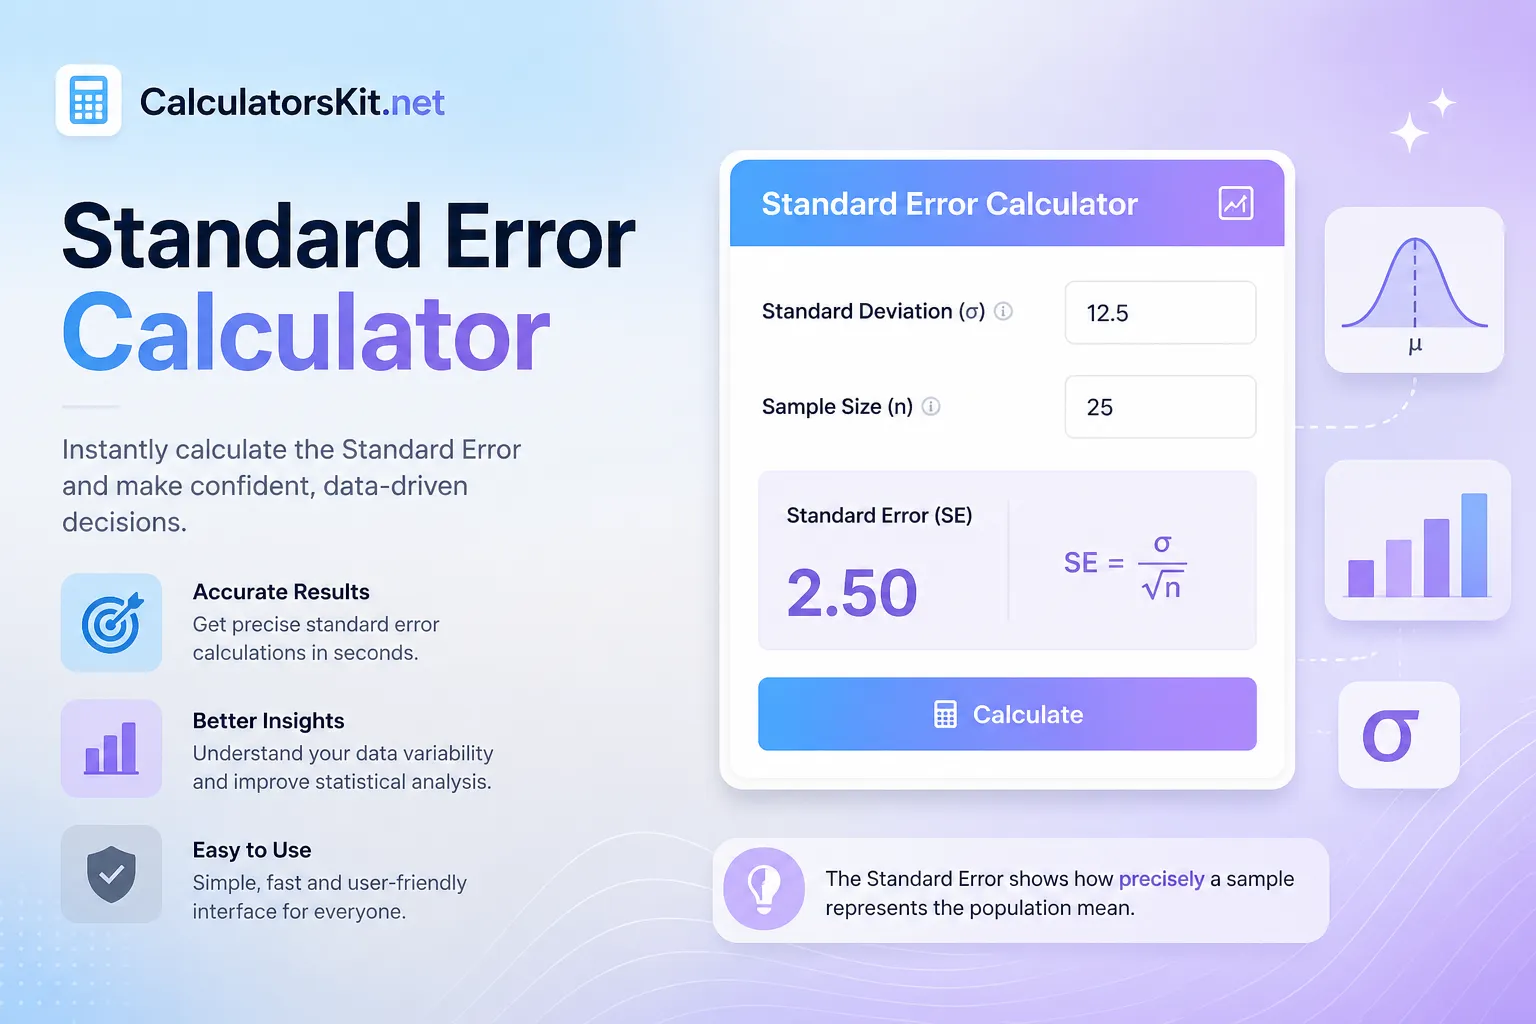
A standard error calculator helps you measure how much a sample statistic, such as a mean or a proportion, is likely to differ from the true value in the full population. Anyone who works with data- students, researchers, analysts, or marketers running A/B tests- eventually needs this number to decide how much to trust a result. This guide explains the standard error formula in plain language, shows worked examples for means, proportions, two samples, and confidence intervals, and walks through calculating standard error by hand, in Excel, and on a Casio calculator. By the end, you will know exactly which formula to use for your situation and how to avoid the mistakes that trip up most beginners.
What Is a Standard Error Calculator and Why It Matters
A standard error calculator takes a sample of data, or summary numbers like the mean and sample size, and returns an estimate of how far your sample statistic is expected to wander from the actual population value if you repeated the study many times. In simple terms, it tells you how reliable your average or your percentage really is.
Standard error is not the same as standard deviation, even though the two are often confused. Standard deviation describes how spread out individual data points are within one sample. Standard error describes how spread out the sample means would be if you drew many different samples from the same population. A smaller standard error means your sample is a more trustworthy stand-in for the population, which is why it shows up everywhere from academic papers to political polling reports.
Standard Error Formula Explained
Standard Error of the Mean Formula
The most common version of the formula is:
SE = s divided by the square root of n
Here, s is the sample standard deviation, and n is the sample size. Notice that as your sample size grows, the denominator grows too, so the standard error shrinks. This is the mathematical reason larger studies produce more precise estimates.
Worked example: A researcher measures the resting heart rate of 25 patients and finds a sample standard deviation of 8 beats per minute.
Take the square root of the sample size. The square root of 25 equals 5.
Divide the standard deviation by that number. 8 divided by 5 equals 1.6.
The standard error of the mean is 1.6 beats per minute.
Standard Error of Proportion Formula
When you are working with percentages instead of averages, for example the share of voters who prefer a candidate, use:
SE = square root of p times (1 minus p), divided by n
Here, p is the sample proportion expressed as a decimal, and n is the sample size. This formula is the backbone of every standard error calculator for proportion and every poll margin of error you see in the news.
How to Use a Standard Error Calculator Online
Most tools follow the same basic workflow, whether you type in raw data or summary statistics.
Choose your data type. Decide whether you are calculating standard error from a mean and standard deviation, from raw data points, or from a sample proportion.
Enter the sample size (n). This is the number of observations, respondents, or data points in your sample.
Enter the standard deviation or the proportion, depending on which formula applies to your data.
Let the calculator apply the formula automatically. A good standard error calculator online does this instantly and shows the formula used, not just the final number.
Read the result in context. A standard error on its own means little; compare it against the size of your mean or proportion to judge precision.
A well-built calculator saves you from small arithmetic slips, particularly when the sample size is large or the numbers involve several decimal places. That said, understanding the formula behind the tool is what lets you catch a wrong result when something looks off, so treat the calculator as a shortcut, not a replacement for understanding.
Standard Error Calculator for Two Samples
When comparing two independent groups, such as a control group and a test group in an experiment, you need the standard error of the difference between two means. The formula combines the individual standard errors of both groups:
SE(difference) = square root of (SE1 squared plus SE2 squared)
Practical scenario: A marketing team runs an A/B test on two landing pages.
Page A: mean conversion value of 42, standard error of 1.2
Page B: mean conversion value of 47, standard error of 1.5
SE of the difference = square root of (1.2 squared plus 1.5 squared) = square root of (1.44 plus 2.25) = square root of 3.69, which is about 1.92
This combined standard error is what feeds into a two-sample t test, so getting it right matters before anyone declares a winning page. A frequent mistake here is simply adding the two standard errors together instead of combining them through the square root of the sum of squares, which overstates the true uncertainty.
How to Find Standard Error From Confidence Interval
Sometimes a report gives you only the confidence interval, not the raw standard error. You can reverse engineer it using the interval width and the z score or t score tied to the confidence level.
SE = (Upper limit minus Lower limit) divided by (2 times the critical value)
Worked example: A study reports a 95 percent confidence interval of 48 to 56 for an average score.
Subtract the lower limit from the upper limit. 56 minus 48 equals 8.
Divide by 2. 8 divided by 2 equals 4, which is the margin of error.
Divide the margin of error by the z score for 95 percent confidence, which is 1.96. 4 divided by 1.96 equals about 2.04.
Result: The standard error is approximately 2.04.
This trick is useful when you are auditing someone else's published numbers, or when a standard error calculator from a confidence interval feature is not built into the tool you are using.
Standard Error Calculator From Mean and Sample Size Alone
People often search for a way to calculate standard error using only the mean and the sample size. Here is the honest answer from a data practitioner's perspective: the mean and sample size alone are not enough. The formula always needs a measure of variability, either the standard deviation or, for proportions, the value of p itself. If a tool asks only for the mean and n, it is either assuming a proportion problem where the mean acts as p, or it is missing a required field. Always check that a standard deviation or proportion value is entered before trusting the output; otherwise, the result is meaningless.
Standard Error vs Standard Deviation: What Is the Difference
Standard deviation measures the spread of individual values inside one sample.
Standard error measures the expected spread of the sample mean across repeated samples.
Standard deviation does not shrink as sample size grows; standard error does.
Standard deviation describes your data; standard error describes your estimate.
Standard Deviation Calculator Using Mean: Quick Formula
To calculate standard deviation from raw data using the mean, subtract the mean from each value, square each difference, average those squared differences, then take the square root of that average. For a sample rather than a full population, divide by (n minus 1) instead of n, a correction known as Bessel's correction that keeps the estimate from being biased on smaller samples.
How to Calculate Standard Error in Excel
Excel has no single built-in standard error function, but you can build one in two steps.
Calculate the sample standard deviation with STDEV.S(range), where range is the cell range containing your data.
Divide that result by the square root of the sample count: STDEV.S(range)/SQRT(COUNT(range))
For a proportion in Excel, use the formula SQRT of p times the quantity of 1 minus p, all divided by n, with p and n entered as cell references. Many analysts wrap this formula inside a named cell so it updates automatically whenever new survey rows are added, which turns a one-time calculation into a live dashboard figure.
Standard Error Calculator With Sample Proportion: Worked Example
A retailer surveys 400 customers and finds that 260 say they would recommend the store, giving a sample proportion of 0.65.
Calculate p times (1 minus p). 0.65 times 0.35 equals 0.2275.
Divide by the sample size. 0.2275 divided by 400 equals 0.00056875.
Take the square root. The standard error is approximately 0.0238, or 2.38 percent.
This means the true recommendation rate across all customers likely sits within a few percentage points of 65 percent, depending on the confidence level chosen.
Common Mistakes People Make When Calculating Standard Error
Confusing standard deviation with standard error and reporting the wrong one in a paper or dashboard.
Using the population size instead of the sample size in the denominator.
Forgetting Bessel's correction (n minus 1) when computing sample standard deviation by hand.
Adding two standard errors directly instead of combining them through the square root of the sum of squares for two-sample comparisons.
Treating a wide confidence interval as proof that a study is flawed, when it may simply reflect a small sample size.
Entering a proportion as a percentage, such as 65, instead of a decimal, such as 0.65, which throws the entire result off by a factor of 100.
Standard Error Symbol in Calculator: What to Look For
On statistical calculators and in software output, standard error usually appears as SE, SEM for standard error of the mean, or the Greek letter sigma with a subscript x bar, written as the standard deviation symbol topped with a bar over the x. On graphing and scientific calculators such as the Casio fx 991 series, statistical mode typically labels this value as x sigma n minus 1 for sample standard deviation, which you then divide by the square root of n yourself, since most handheld calculators compute standard deviation directly but leave the final standard error division to the user.
Standard Deviation on Casio Calculator: Quick Guide
Most Casio scientific calculators, including the fx 82 and fx 991 families, calculate standard deviation through STAT mode.
Press MODE, then select STAT (usually option 2 or 3 depending on the model).
Choose 1 Var mode for a single list of data.
Enter each data value followed by the equals or AC key to confirm it into the list.
Press AC, then open the STAT VAR menu to view the results.
Look for x sigma n for the population standard deviation or x sigma n minus 1 for the sample standard deviation.
Once you have that sample standard deviation figure, divide it by the square root of your sample size to get the standard error by hand, exactly as shown earlier in this guide.
Real World Use Cases: Where Standard Error Matters
Scientific research: Journals require standard error or confidence intervals alongside every reported mean so other researchers can judge precision.
Political and market polling: Every published poll margin of error is built directly from the standard error of a sample proportion.
Quality control in manufacturing: Engineers track the standard error of measurements across production batches to catch process drift early.
Finance and investing: Analysts use standard error to judge how reliable a sample-based estimate, such as average returns, really is before making decisions.
Marketing experiments: A/B testers rely on the two-sample standard error formula to decide whether a lift in conversions is real or just noise.
Conclusion
Standard error is one of those statistics that looks intimidating on paper but becomes intuitive once you see it applied to a real dataset. Whether you need a quick standard error calculator online for a homework assignment, a std error calculator for a two-sample business experiment, or you are cross-checking a formula on a Casio calculator, the underlying logic never changes: variability divided by the square root of sample size. Master that one relationship and every version of this calculation, from proportions to confidence intervals, becomes easy to reason through instead of something you just plug into a box and hope for the best.
Frequently Asked Questions
Q: What does a standard error calculator actually calculate?
It estimates how much a sample statistic, such as a mean or proportion, would vary if you repeated your sampling process many times. A smaller result signals a more precise, trustworthy estimate.
Q: Is standard error the same as margin of error?
No, but they are related. Margin of error equals the standard error multiplied by a critical value, such as 1.96 for a 95 percent confidence level. Standard error is the raw building block; margin of error is the applied result.
Q: Can I calculate standard error without knowing the standard deviation?
Only if you are working with a proportion, since the proportion itself supplies the needed variability. For a mean, you always need either the standard deviation or the raw data points to derive it first.
Q: Why does standard error decrease as sample size increases?
Because sample size sits in the denominator under a square root. Quadrupling your sample size cuts the standard error in half, which is why researchers chase larger samples when precision matters most.
Q: Does a standard deviation calculator using mean give the same result as a standard error calculator?
No. A standard deviation calculator using the mean measures spread within your sample. To get standard error, take that standard deviation result and divide it by the square root of the sample size.
Related Articles

Learn how to calculate a car loan payment using APR, interest, loan term, trade-in, and simple formulas. See examples and avoid costly mistakes.

Use a free overtime calculator to calculate overtime pay from an hourly or monthly salary. Learn formulas, rates, Pakistan rules, and common mistakes.

Learn how to calculate percentages with easy formulas, step-by-step examples, discounts, grades, percentage increase, decrease, and Excel formulas.

See WhatsApp API pricing in 2026, cost per message, Meta fees, BSP markups, Pakistan rates, and how to calculate your monthly WhatsApp API cost.